CPU Usage Benchmarks (macOS)
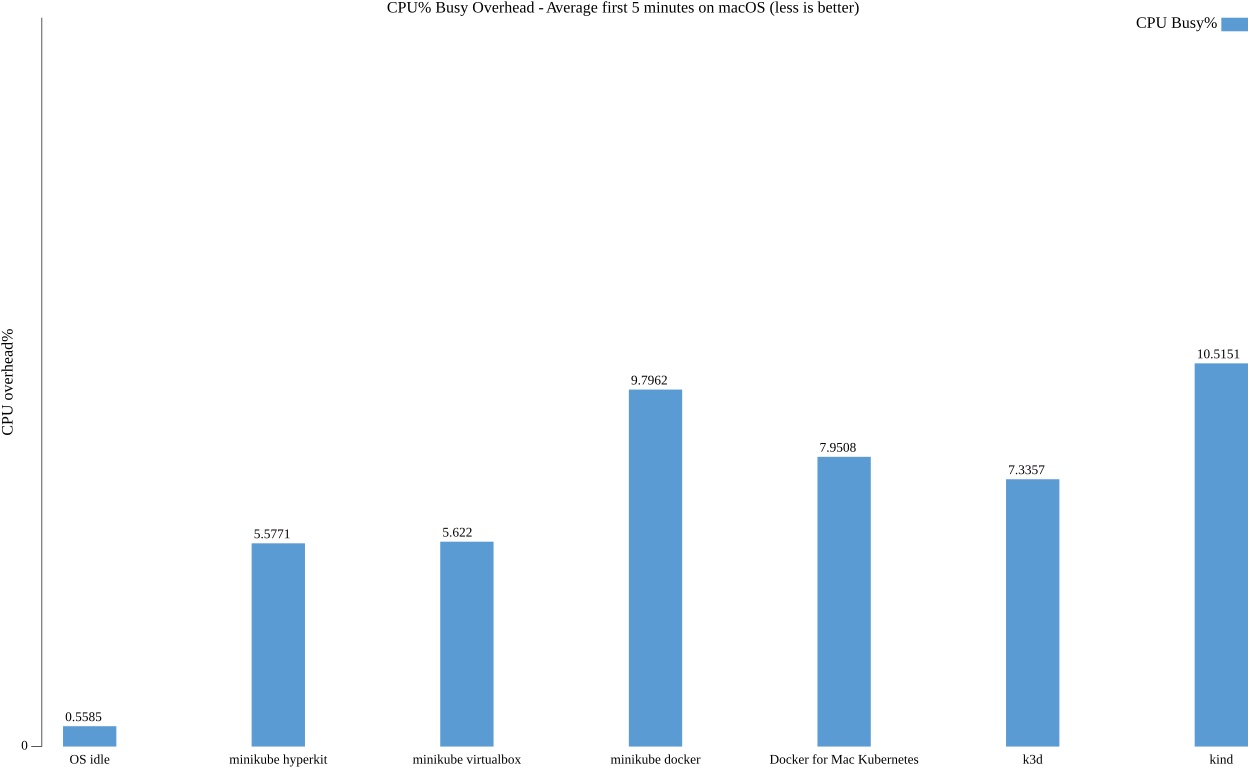
CPU% Busy Overhead - Average first 5 minutes only
This chart shows each tool’s CPU busy overhead percentage. After each tool’s starting, we measured each tool’s idle for 5 minutes. This chart was measured only after the start without deploying any pods.
- start each local kubernetes tool
- measure its cpu usage with cstat
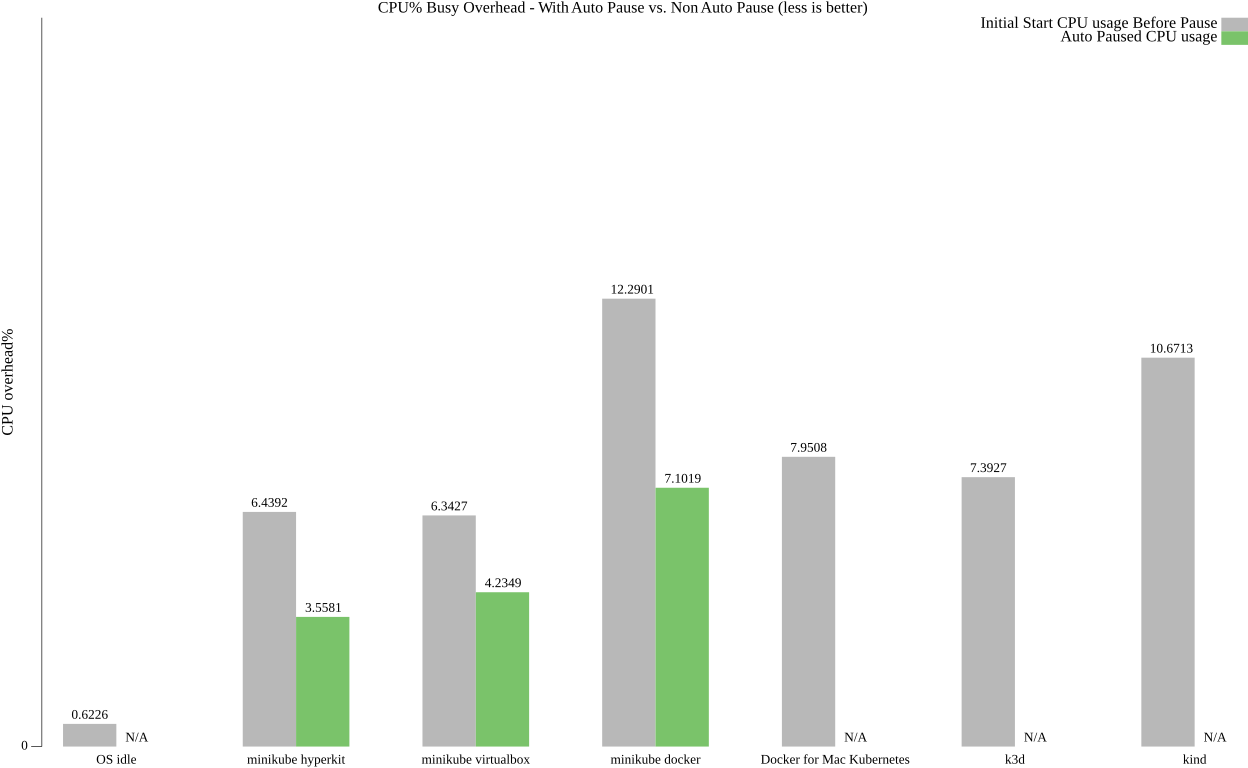
CPU% Busy Overhead - With Auto Pause vs. Non Auto Pause
This chart shows each tool’s CPU busy overhead percentage with auto-pause addon. The auto-pause is mechanism which reduce CPU busy usage by pausing kube-apiserver. We compare CPU usage after deploying sample application (nginx deployment) to all tools (including minikube and other tools). This chart was measured with the following steps. By these steps, we compare CPU usage with auto-pause vs. non-auto-pause.
- start each local kubernetes tool
- deploy sample application (nginx deployment) to each tool
- wait 1 minute without anything
- measure No.3 idle CPU usage with cstat
- if tool is minikube, enable auto-pause addon which pause control plane
- if tool is minikube, wait 1 minute so that control plane will become Paused status (It takes 1 minute to become Pause status from Stopped status)
- if tool is minikube, verify if minikube control plane is paused
- if tool is minikube, wait 3 minute without anything
- if tool is minikube, measure No.8 idle CPU usage with cstat
No.1-4: Initial start CPU usage with sample (nginx) deployment No.5-9: Auto Paused CPU usage with sample (nginx) deployment
Feedback
Was this page helpful?
Glad to hear it! Please tell us how we can improve.
Sorry to hear that. Please tell us how we can improve.